Program Progress:
You are incorrect - the best interpretation of the electrocardiogram in our patient is non-specific ST-T abnormalities.
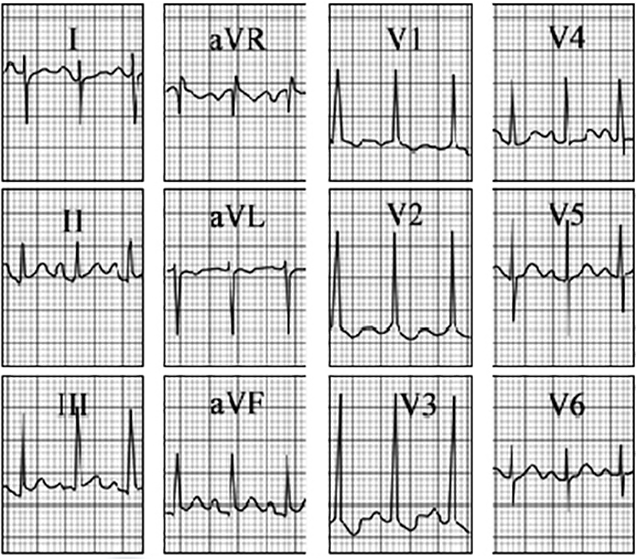
Your choice: Right ventricular hypertrophy + right axis deviation
This electrocardiogram shows right ventricular hypertrophy and right axis deviation.
The features of right ventricular hypertrophy demonstrated here include: tall R waves in leads V1 through V3, with associated T wave inversions + ST segment depressions in the same leads; and right atrial enlargement enlargement demonstrated by a tall P wave in lead II.
Right axis deviation, also a feature of right ventricular hypertrophy, is demonstrated by the predominantly negative QRS complex in lead I.