Program Progress:
You are incorrect - the best interpretation of the electrocardiogram in our patient is non-specific ST-T abnormalities.
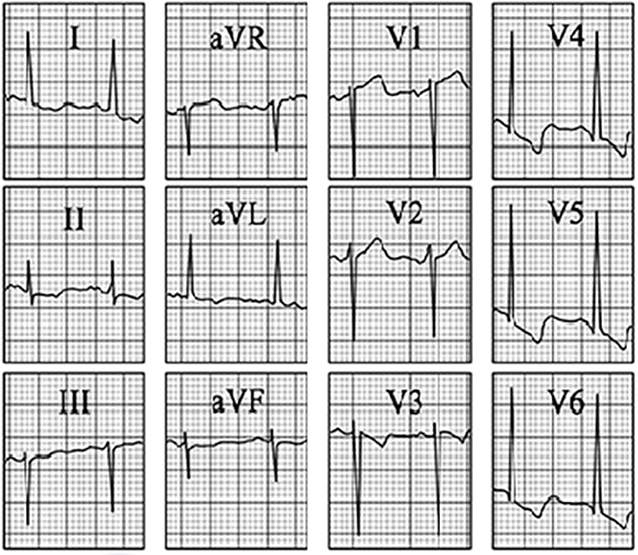
Your choice: Left ventricular hypertrophy + left atrial enlargement
This electrocardiogram shows left ventricular hypertrophy and left atrial enlargement. The features of left ventricular hypertrophy demonstrated here include increased voltage, reflected by the S wave in V1 + R wave in V5 exceeding 35 mm. Associated tall R waves in leads I and V4 through V6; and ST-T wave abnormalities well seen in the same leads. Left atrial enlargement, also consistent with left ventricular hypertrophy, is demonstrated by the broad, notched P wave in lead II.